It's an exciting world right now... i-Stuff and the spread of "design" as a buzzword aside, I'm thrilled by the spread of data and graphs into the public world.
A few recent pointers on the theme of public data exploration:
- Gapminder.org's Hans Rosling presented to TED a year ago, with the beautiful animated charts that his site made famous. His final comments say, in paraphrase, "Publically funded data is public, but hard to get at, hard to search, and presented in boring ways. We can and should change this." One of his great takeaways, for me, from his data illustrations of "third world" healthcare is that the error in the data is no doubt much less than the truth in it, at the magnitudes he illustrates.
- Swivel is a new site for data upload and exploration, with a fun blog. They also allow community discussion around their charts. I like their enthusiasm and enjoy the blog a lot.
- Friends from IBM (Martin Wattenberg and his group) have just announced a similar concept to Swivel's, but with even more graph types and they're all nicely interactive. Upload data, create a picture, and post it... other people can play with your data and present their own insight pictures, or modify yours. And comment on them. It's Many Eyes, and it even has a nice website!
- Google claims to be making real time stock quotes available, which means live data plotting is possible. Found on swivel's blog, a post on Googleblog: Real Time Quotes for Free.
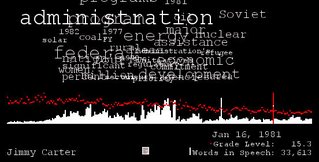
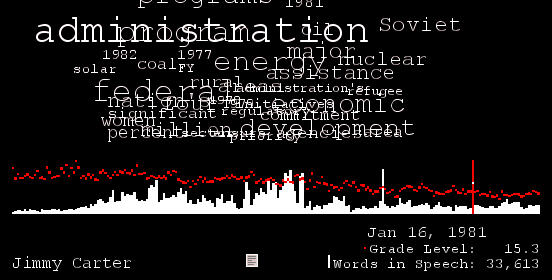
- And don't forget processing.org. There's a nice visualization of State of the Union speeches highlighted there, including word frequencies and grade levels of the speech. (It's by Brad Borevitz.) They've been averaging around 9th or 10th grade level, but notice the great spike of Jimmy Carter's at grade 15.
2 comments :
Hi there, thanks for the post about Swivel. We were already fans of gapminder.org, Many Eyes, and the Google Finance real time data announcement, but processing.org is new to us and looks very interesting.
Thanks again for the post.
Brian Mulloy
CEO & Cofounder
www.swivel.com
I'm also a huge fan of this trend - but with a caveat. With some data (particularly scientific measurements) it is important to realize how it was gather and processed along with the scale and nature of the errors. As someone deals with this sort of data they need to publish their own methodology and propagate errors appropriately..
With *really* open data, as in sausage, you need to understand how it was created and how it is used,
Post a Comment